

For this, my data set is first through fourth round EDGEs from 2005-2014.
Tonight, I decided to file through and see how many players were still in the NFL, split into both rounds and categories (Force Players, Mid Tiers and Non-Force Players.)
Some players do not fit in any of the three, as I either have missing or incomplete data. Those players are: Tamba Hali, Shawne Merriman (would be a Force Player or Mid Tier, but not sure which without complete data), Tank Carradine, Phillip Merling, Victor Abiamiri, Brent Urban, John Simon, O’Brien Schofield, Slade Norris, Henry Melton, William Hayes, Elvis Dumervil and Chris Canty.

Above is the first round split into the three categories. Of 2005-2014 first round Force Players, around 91.3 percent of them are still in the NFL. For Non-Force Players, that number is 63.2 percent.
You’ll also notice that the first round is the only split in which Non-Force Players don’t vastly outnumber the rest of the categories. In the first round, 62 percent of the EDGEs from 2005-2014 were either Force Players or Mid Tiers. In the second, that drops to around 26 percent, less than half the rate, then to 21 percent in the third, eventually rising slightly to 24 percent in the fourth.
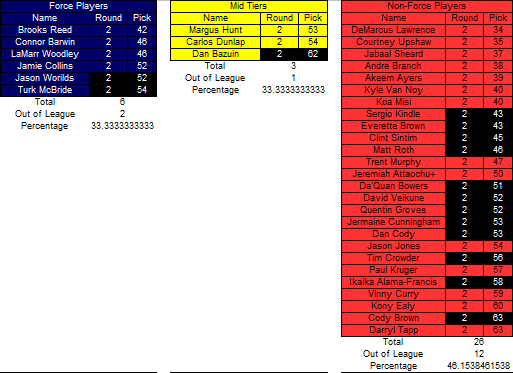
Again, we see about a 10 percent difference between Force Players and Non-Force Players in the second round. That’s including Jason Worilds, who was offered a contract this offseason, but chose to hang up his cleats.

Ditto in the third round. For the most part, the second and third round have been about the same in both percentage of players out of the league and by measuring success in Approximate Value/Year.

The fourth round get sloppier for every category, but Force Players once again finish about 10 percent better. Mid Tiers are victims of having a sample size of two.
Total player splits by category (first, second, third, fourth round, total):
Force Players (23, 6, 3, 8, 40)
Mid Tiers (8, 3, 3, 2, 16)
Non-Force Players (19, 26, 23, 31, 99)
Percentage of players out of the league splits by category (first, second, third, fourth round, total):
Force Players (9, 33, 33, 50, 23)
Mid Tiers (38, 33, 33, 100, 44)
Non-Force Players (37, 46, 48, 61, 49)
I think when you exclude fourth rounders, as they weigh everyone down significantly, and because the term “top-100” is used so frequently with meaning, the numbers become more true to the story. No one is expecting a fourth round defensive end to become a starter, or at least they shouldn’t.
Percentage of players out of the league splits by category (first, second, third round, total):
Force Players (9, 33, 33, 16)
Mid Tiers (38, 33, 33, 36)
Non-Force Players (37, 46, 48, 44)
Top-100 Non-Force Players are nearly three-times as likely to slip out of the league in this time frame as Force Players. If I have the time, I may rebuild my AV/Y data to document the test I ran before, but before the Mid Tiers split from Force Players, Force Players’ average in every round scored double what Non-Force Players averaged.
Athleticism matters when put into the proper context. Don’t let anyone tell you differently.
If you have any comments or questions, make sure to either email me at [email protected] or ask me on Twitter.
Justis Mosqueda
Latest posts by Justis Mosqueda (see all)
- Free Agency One-Stop: Bruce Irvin, EDGE/LB, Seattle Sehawks - March 7, 2016
- Free Agency One-Stop: Olivier Vernon, EDGE, Miami Dolphins - March 5, 2016
- Justo’s Top Six - March 2, 2016