

Intro
A trade happens – either on draft day, or right before (like the recent Tennessee/L.A. and Cleveland/Philadelphia trades).
What type of analysis do you hear and read from sports reporters?
Usually, it’s that one team ‘got a haul of picks’ while the other team ‘paid a lot to move up and get their guy’.
The problem with that analysis is that it isn’t actually analysis.
Who got the better end of the deal objectively?
Is there a way to measure the value of these trades without having to predict which players they might end up with (which is impossible)?
When trades are lopsided, what is the driving force?
Let’s answer those questions.
A Quick History of Draft Pick Trades
The NFL Draft has been going on decades, but it’s not particularly useful to look at the full history, as the game has simply changed so much over the years (it would also be WAY too much work).
The history I chose to look at is 2011 – present. Why 2011? Because that was the first draft year where the rookie salaries were capped and structured. To give you an idea of how significant this change was:
In 2010, the 1st overall pick – Sam Bradford – received a 6 year, $78 million contract ($50 million guaranteed).
In 2011, the 1st overall pick – Cam Newton – received a 4 year, $22 million contract ($22 million guaranteed).
By limiting the values of rookie contracts, teams could become more aggressive in trading up to the top picks in the draft, because they wouldn’t have to give up a ton of draft pick ammunition and a massive contract to an unknown rookie. They’d still have to give up the draft pick ammunition (see the L.A. and Philly trades this year) but the rookies they select are guaranteed to sign affordable contracts.
So with that, let’s take a look (I got my trade data from Pro Football Reference, and did a lot – way too much – data splicing by myself).
- Since 2011, there have been 121 trades involving just draft picks (I omitted trades involving actual players).
- That comes out to an average of 7.5 trades per NFL team. The most frequent traders are the 49ers (18 trades), Browns (16 trades), and Vikings (14 trades). At the opposite end are the Bengals and Chiefs (just 2 trades each).
- The Bucs, Chargers, Giants, Jets, and Falcons love to trade up – they’ve done so 23 out of the 25 times that they’ve executed draft trades.
- On the other side of the spectrum, the Redskins, Cardinals, Raiders, and Seahawks love to trade down – they’ve done so 30 out of 34 times.
Now the obvious question: how do we tell who is getting the better end of a trade? One way to measure performance is by using the NFL Trade Value Chart.
The NFL Trade Value Chart
This chart – with credit going to Jimmy Johnson for its creation – attempts to quantify the value of every NFL pick using a points system. For two easy examples, let’s look at the two recent trades between Tennessee/L.A. and Cleveland/Philly:
Titans/Rams Trade
Titans receive:
- Pick 15 (round 1) – 1050 points
- Pick 43 (round 2) – 470 points
- Pick 45 (round 2) – 450 points
- Pick 76 (round 3) – 210 points
- Rams’ 2017 round 1 pick – 1000 points (used the middle of the round (pick 16) as an average since we don’t know the actual pick)
- Rams’ 2017 round 3 pick – 195 points (used the middle of the round (pick 79) for same reason)
- => Titans total points: 3375
- Pick 1 (round 1) – 3000 points
- Pick 113 (round 4) – 68 points
- Pick 177 (round 6) – 20.2 points
- => Rams total points: 3088
Browns/Eagles Trade
Browns receive:
- Pick 8 (round 1) – 1400 points
- Pick 77 (round 3) – 205 points
- Pick 100 (round 4) – 100 points
- Eagles’ 2017 round 1 pick – 1000 points
- Eagles’ 2017 round 2 pick – 420 points
- => Browns total points: 3125 points
- Pick 2 (round 1) – 2600 points
- Pick 112 (round 4) – 70 points
- => Eagles total points: 2670 points
The answer, in my opinion, is yes. Take a look at this graph:
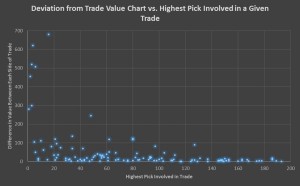
On the x-axis, we have the highest pick involved in the trade. For example, if we plotted the Rams/Titans trade on this graph, its x-axis value would be 1. If we plotted the Browns/Eagles trade on this graph, its x-axis value would be 2. And so on.
- 50% of all trades netted a difference of 14 points or less, which equates to merely a 7th round draft pick.
- 66% of all trades netted a difference of 28 points or less, which equates to a 6th round draft pick. Not quite as worthless as a 7th rounder, but still pretty worthless – scrub / washed up players are traded consistently for 6th round compensation.
- 85% of all trades (104 out of 121, so nearly all of them) netted a difference of 100 points, which equates to a 4th round draft pick.
Another way to look at the 85% conclusion is that teams don’t seem to be bothered by giving up the equivalent of a 4th round pick in value if it means they can execute the trade they want to execute.
Winners and Losers
We’ve already reasoned that, about 85% of the time, draft pick trades are pretty equal. So what about that other 15% (or 17 of the 121 total trades)?
For starters, we know someone is winning. When you sum the differences in value (our y-axis values above) for those 17 lopsided trades , the total is 6,066 points or about 357 points per trade. In other words, within those 17 trades, the losing team was, on average, giving up the 54th overall pick for free.
What could cause teams to behave so recklessly? Let’s keep digging.
- 8 of those 17 trades involved a team trading for one of the top six picks in the draft, and those 8 trades accounted for about 70 percent of the 6,066-point disparity. In other words, trades involving the top six picks in the drafts are usually a rip off for someone.
- The poster child for this conclusion is the RGIII trade mentioned above, where the Redskins gave up the 6th overall pick, 39th overall pick, and two future 1st round picks to move up to the 2nd overall pick. Washington lost 1510 points in that deal, which corresponds to the 7th overall pick!
- Surprisingly, the team trading down isn’t always the one getting the great deal. In 3 of the 8 trades, the team trading up actually got the better end in terms of the Trade Value Chart.
Finally, we have some nice conclusions. Trading in the top six is usually bad for someone, and that makes sense. The NFL is a business, and trade talks are nothing more than business negotiations. Business negotiations are decided by leverage. If one party is desperate – whether to move up or down in the draft – they are likely to get smoked in negotiations.
So, what’s the message to NFL GMs? If you’re in the top 6, simply plan to stay put, and let the desperate teams come to you until they make you an offer you can’t refuse. I said it in my salary cap article and I’ll say it again here… I don’t think it’s that hard. Seriously.
Jack
Loves data-driven, analytical approaches to NFL analysis.
Also loves pizza, gin, and taking co-ed sports too seriously.
Latest posts by Jack (see all)
- The Ridiculous Power of Contract-Year Motivation: Running Backs - May 26, 2016
- NFL Draft Day One: Trade Recap, Analysis - April 29, 2016
- Understanding and Assessing NFL Draft Trades (and claiming I’m smarter than NFL GMs) - April 25, 2016